Running Costs for an Electric Car in Australia
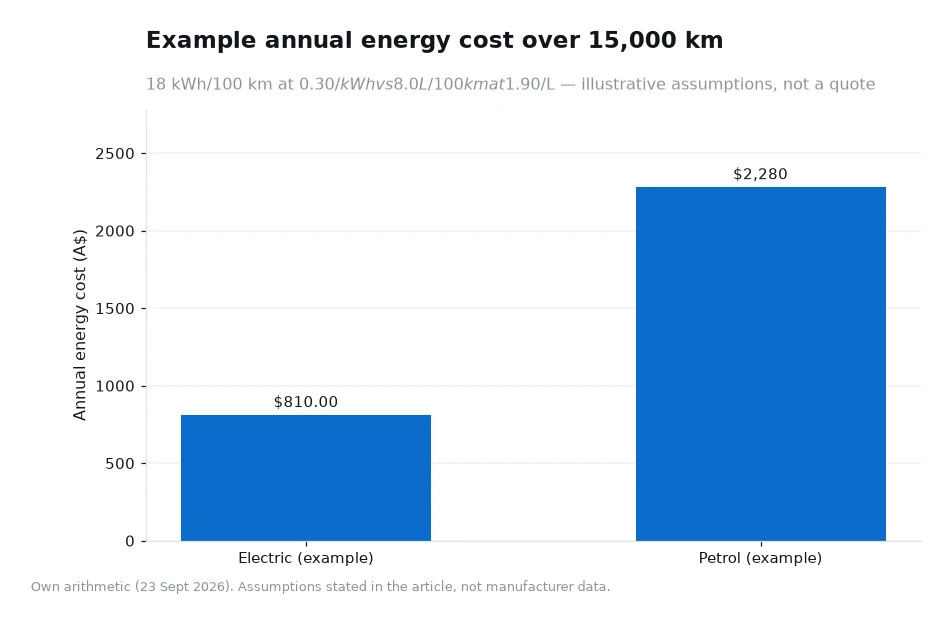
Energy is the least expensive part of running an electric car, and it is also the part people guess at most wildly. On a labelled set of assumptions — 18 kWh per 100 km at $0.30 per kWh — a year of 15,000 km costs about $810 of electricity. The petrol equivalent in the same example, at 8.0 L per 100 km and $1.90 per litre, comes to $2,280. The gap is $1,470 a year, and the three inputs that produce it are yours to change.

Key takeaways
- On the assumptions used here, energy costs about $5.40 per 100 km, against $15.20 per 100 km for the petrol comparison.
- The New G6 is published with up to 525 km of WLTP range and a 10–80% state-of-charge window of 12 minutes; WLTP range depends on conditions.
- Servicing is published at every 12 months or 20,000 km, whichever comes first, but no service prices are published for Australia.
- Scheduled servicing, insurance, registration and tyres sit outside the energy comparison and should be added separately.
Three inputs decide almost everything
Running cost per kilometre is a multiplication of three numbers: how much energy the car uses per 100 km, what you pay per kilowatt-hour, and how far you drive. Everything else — the size of the battery, the badge on the nose, the colour of the paint — either feeds into those three or does not affect the answer at all. That is why two owners of the same model can quote figures that differ by half, and both be telling the truth.
Consumption depends on speed, temperature, load and terrain. Tariff depends on your retailer, your metering and whether you charge at home or on the road. Distance depends on you. The only one of the three that a manufacturer can publish is consumption measured on a standard cycle, and even that comes with a condition: the published WLTP range figures depend on conditions, so consumption in the real world will differ from the test.
What is published, and what is modelled
It is worth separating the two, because mixing them is how running-cost arguments go wrong. Published figures come from the manufacturer; modelled figures are the writer's assumptions and should always be labelled as such.
| Published by the manufacturer | Modelled in this article |
|---|---|
| WLTP range up to 525 km for the New G6 | 18 kWh per 100 km real-world consumption |
| 10–80% state of charge in 12 minutes | $0.30 per kWh electricity tariff |
| Scheduled maintenance every 12 months or 20,000 km | 15,000 km of driving a year |
| Whole vehicle warranty 7 years / unlimited km, private use | 8.0 L per 100 km and $1.90 per litre for the petrol case |
| Key parts warranty 8 years / 160,000 km | No charging losses, road tolls or parking included |
Worked example: a year of energy, step by step
Assumptions, all stated up front: 15,000 km a year, 18 kWh per 100 km, electricity at $0.30 per kWh, and a petrol comparison at 8.0 L per 100 km with fuel at $1.90 per litre. No vehicle price appears anywhere, because the manufacturer publishes none for Australia; this is an energy comparison only.
Convert distance into blocks of 100 km: 15,000 ÷ 100 = 150 blocks. Electricity: 150 × 18 kWh = 2,700 kWh. 2,700 × $0.30 = $810 for the year. Per 100 km that is 18 × $0.30 = $5.40, and per kilometre $810 ÷ 15,000 = $0.054, or 5.4 cents.
Petrol: 150 × 8.0 L = 1,200 L. 1,200 × $1.90 = $2,280 for the year. Per 100 km that is 8.0 × $1.90 = $15.20, and per kilometre $2,280 ÷ 15,000 = $0.152, or 15.2 cents. The difference over the year is $2,280 − $810 = $1,470, which is about $122 a month, and per kilometre it is 15.2 − 5.4 = 9.8 cents saved for every kilometre driven.
Where those numbers move in the real world
Three sensitivities are worth testing in your own spreadsheet. First, tariff: at $0.20 per kWh the annual electricity figure falls to 2,700 × $0.20 = $540, a saving of $270 against the base case; at $0.45 it rises to $1,215. Second, consumption: at 22 kWh per 100 km the same year needs 150 × 22 = 3,300 kWh, which is $990 at $0.30. Third, distance: cutting 15,000 km to 12,000 km reduces both sides of the comparison by a fifth.
Public fast charging sits at the top of the tariff range, and home charging overnight sits at the bottom, so the mix you use matters. The manufacturer's charging page notes that XPENG vehicles work with most public Type 2 AC and CCS2 DC fast chargers, and that home charging features include a charging schedule, plug-and-charge and Smart Guard anti-theft locking — a schedule is the simplest way to keep most of your energy on an off-peak rate.
A second example: shorter distances, different speeds
The first example used a rounded national-scale household. Run it again for a smaller driver, with the assumptions changed openly: 10,000 km a year, 16 kWh per 100 km in mostly suburban running, and the same $0.30 per kWh. Distance in blocks: 10,000 ÷ 100 = 100 blocks. Energy: 100 × 16 kWh = 1,600 kWh. Cost: 1,600 × $0.30 = $480 for the year, which is $4.80 per 100 km and 4.8 cents per kilometre.
Now add a charging-loss assumption, because energy drawn from the wall is always a little more than energy stored in the battery: assume 10% losses, so 1,600 kWh × 1.10 = 1,760 kWh drawn, which is $528 at $0.30 per kWh. The same car driven mostly at highway speed on 22 kWh per 100 km would need 100 × 22 = 2,200 kWh, or $660 before losses. City driving is usually the cheaper duty cycle for an electric car, which is the opposite of the petrol pattern and a good reason to model your own mix rather than borrow someone else's average.
What energy cost leaves out
Energy is not the whole running cost, and presenting it as though it were is the most common flaw in this genre of article. Servicing is published as every 12 months or 20,000 km, whichever comes first, at an Authorised Dealer, but no service prices are published for Australia, so any servicing figure you read should be treated as an assumption. Tyres, insurance and registration are outside the comparison entirely: tyres on a heavier car wear differently, insurance is quoted per driver and postcode, and registration varies by state.
The seven-seat X9 and the New G6 will not return identical consumption figures, because mass and frontal area both matter. The method above still works for either: put your own consumption, your own tariff and your own annual distance into it, and the answer will be honest even if it differs from this article's.
Frequently asked questions
Is electricity always cheaper than petrol per kilometre?
On the assumptions used here, yes by a wide margin — 5.4 cents against 15.2 cents per kilometre — but the margin narrows if you rely mainly on public fast charging at a high tariff and drive a car with high consumption.
How much does servicing add to the running cost?
No service prices are published for Australia, so the honest answer is that it depends on your dealer and your annual distance; start with the published 12-month or 20,000 km interval and build your own figure.
Build your own version in ten minutes
Write three numbers on a notepad: your annual kilometres, a realistic energy figure per 100 km, and the rate you actually pay per kilowatt-hour. Multiply kilometres by consumption and divide by 100 to get kilowatt-hours, then multiply by your rate. Do the same with litres for the car you drive now, and compare the totals rather than the stickers.
Then revisit it twice a year. Tariffs change, your commute changes, and the numbers you wrote down in autumn may be wrong by spring. Ask two owners of the same model what they pay: reported costs for electric cars australia owners can differ by half, and the difference is nearly always the tariff and the right foot rather than the car.
Specifications come from the manufacturer's Australian site at xpeng.com/au, read 23 Sept 2026, including the footnote that WLTP figures depend on conditions. The 15,000 km, 18 kWh per 100 km, $0.30 per kWh, 8.0 L per 100 km and $1.90 per litre inputs are illustrative assumptions, not manufacturer data.[1]